At some point on call you will meet the error Too many parts (N). Merges are processing significantly slower than inserts. Ingestion has stalled, writes are being rejected, and a dashboard downstream is going empty. It reads like a crisis, and it can become one. It is also ClickHouse telling you something specific and mechanical about how your data is being written. Understand the mechanism and the whole thing gets a lot less scary, even at 2 a.m. from a phone.
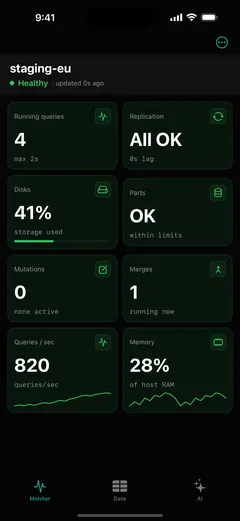
The mechanism also explains why OPTIMIZE FINAL, the first thing most people reach for, usually makes the situation worse. The screenshots below come from ProbeDeck.
Where parts come from
ClickHouse’s MergeTree engine does not update rows in place. Every INSERT writes one or more immutable data parts on disk, a self-contained chunk of sorted, compressed columns. A part is never modified after it is written; it is only ever read, merged, or dropped.
Left alone, that would produce an ever-growing pile of little files. A background process merges small parts into bigger ones instead: two or ten small parts become one larger part, then those combine again. This is the same compaction idea behind any LSM-style store. It is why ClickHouse can absorb high write throughput and still serve fast reads, as long as the merges keep up.
“Too many parts” is exactly the moment merges stop keeping up.
Why the signal fires
The active part count for a table climbs when parts are being created faster than they are being merged away. The cause is almost always on the write side:
- Too many tiny inserts. Row-by-row inserts, or hundreds of tiny batches per second, each create at least one part. A thousand single-row inserts make a thousand parts; the same thousand rows in one batch make one. This is the classic cause.
- Over-partitioning. Parts never merge across partition boundaries. If your
PARTITION BYis too granular, by hour or by a high-cardinality column, you multiply the part count and starve merges of anything large to work with. A partition per day is usually plenty; a partition per customer per hour is a trap. - Merges starved of resources. If the background merge pool is saturated, or CPU and disk IO are pinned by heavy queries, merges fall behind even with reasonable inserts.
ClickHouse defends itself here. As the active part count in a partition rises, it first slows inserts down, and past a hard limit it rejects them outright with that Too many parts message. That rejection is a safety valve. It stops you from burying the table in parts it can never dig out of.
Reading it from your phone
Two system tables carry the whole story, and a mobile client can put both in front of you in seconds.
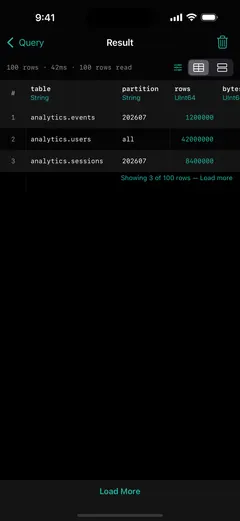
system.parts holds one row per part. Filter to active parts and count them per table and per partition, and you can see precisely where the pile-up is: one runaway partition, or the whole table. ProbeDeck surfaces this as a “too many parts” warning with a configurable per-partition threshold, plus a parts drill-down that breaks the count down by partition so you are not guessing.
system.merges shows the merges in flight right now, with their progress. Your next move hangs on one question: are merges running and advancing, or is nothing happening? If merges are progressing, the system is digesting a burst and may need a little time. If the merge list is empty while parts keep climbing, something is wrong upstream: a merge pool exhausted, a config limit, or an insert pattern that no amount of merging can catch. That case has its own runbook: five checks for a stuck ClickHouse merge.
Monitoring both of these is free in ProbeDeck. Reading system.parts and system.merges changes nothing on the cluster; you are only looking.
What fixes it
The durable fixes all live upstream, in how data arrives:
- Insert in larger batches. This is the single biggest lever. Buffer rows in the application and write them in chunks of tens of thousands, not one at a time.
- Use async inserts. ClickHouse can batch small inserts server-side into larger parts, which smooths out clients that insist on writing little and often.
- Cut partition cardinality. Revisit
PARTITION BY. Coarser partitions mean fewer, larger parts and merges that can keep up. - Give merges room. Make sure the background merge pool and IO budget are not being starved by everything else on the box.
None of these are things you finish from a phone at 2 a.m. The phone gives you the diagnosis, this table, this partition, inserts far outrunning merges, and the confidence to hand it to the pipeline owner (or your morning self) with specifics instead of a vague “ingestion is weird.”
Why OPTIMIZE FINAL is a dangerous reflex
The tempting one-liner is OPTIMIZE TABLE … FINAL. It forces a merge right now, collapsing a partition’s parts into one, and the part count drops immediately. It also comes back.
OPTIMIZE FINAL is expensive. It rewrites entire partitions from scratch, which can consume large amounts of CPU, disk, and IO for as long as it runs. On a cluster that is already struggling to merge fast enough, throwing a full-partition rewrite at it competes for the exact resources merges are short on and deepens the backlog. It also treats the symptom: it flattens the parts you have without changing the insert pattern that created them, so unless you fix ingestion, they pile up again.
There are legitimate moments to force a merge: you understand the table, the cluster has headroom, and you have decided this specific OPTIMIZE is worth it. That is an occasional tool. Because it is a write and a heavy maintenance operation, ProbeDeck puts OPTIMIZE behind the Pro tier, gates it behind a hard type-to-confirm step with a production badge, and says outright that it is expensive before you run it.
Where this leaves you on call
“Too many parts” is one of the more legible signals ClickHouse produces. From your phone you can see the active part count climbing, check system.merges to learn whether merges are moving, and drill into the exact partition that is bloated, all read-only, all free. If you must force a merge to buy breathing room, you can do that too, behind a confirmation that makes you mean it.
The fix almost always belongs in the ingestion pipeline, whether that is bigger batches, async inserts, or saner partitioning. From the phone you turn a red alert into a precise diagnosis, so the real fix lands in the right place.
ProbeDeck connects to your cluster over TLS or an SSH bastion, with credentials held in the iOS Keychain. There is no account and no backend in the middle.
ProbeDeck is a native iOS ClickHouse client: free monitoring, with a one-time Pro unlock ($19.99) for operations like OPTIMIZE, killing queries, writes, and the AI assistant. No subscription.
Related: A native ClickHouse client for iOS · Reading system.parts and the six other on-call tables · How to monitor ClickHouse from your iPhone · Why is my ClickHouse replica lagging?