ClickHouse is usually operated from a laptop: a SQL console, a Grafana dashboard, maybe a terminal on a bastion host. Incidents do not wait for you to be at your desk. An alert fires at 2 a.m., ingestion is backing up, a dashboard is timing out, and the question is simple: is the cluster okay, and if not, what do I do right now?
A handful of system.* tables carry the on-call signal, and the order you read them in decides how fast you get out of the incident. The screenshots come from ProbeDeck, a native iOS client built for this, and the reasoning holds whatever tool you reach for.
Start with the health of the whole cluster
Half-awake, a wall of numbers gets you nowhere. The most useful first screen is a set of health tiles, each summarising one subsystem and graded healthy, warning, or critical:
- Running queries. How many, and how long is the oldest one?
- Replication. Is any table lagging or read-only?
- Disks. How much free space is left?
- Parts. Is any table accumulating too many parts?
- Mutations & merges. Is anything stuck or piling up?
- QPS & memory. Is the load normal for this time of day?
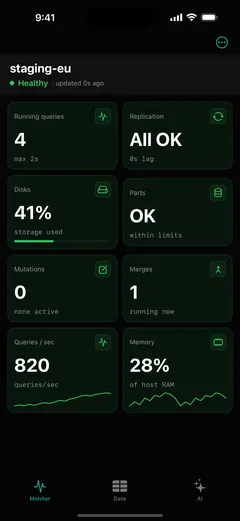
That grading is the whole point. A red tile tells you where to look; the green ones let you rule things out and go back to sleep. The dashboard answers “is it okay?” before you type a single query.
The system tables that matter on call
ClickHouse exposes its own state through the system database, and a handful of tables carry almost all of the on-call signal.
system.processes lists every query running right now, with query_id, user, elapsed, memory_usage, and rows read. This is where you find the runaway SELECT that is eating the cluster. If the “running queries” tile is red, this is the table behind it.
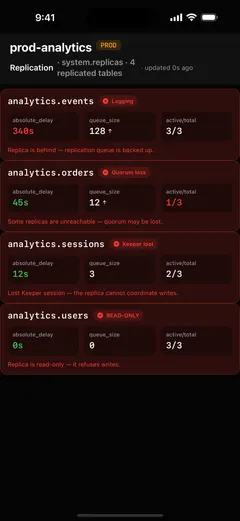
system.replicas and system.replication_queue carry replication health per table. Watch absolute_delay (how far a replica has fallen behind), queue_size (how much work is waiting), and is_readonly (a red flag: the replica has lost its connection to Keeper and cannot accept writes). Replica lag is a ClickHouse-specific failure that generic database tools do not surface at all.
system.parts and system.disks cover storage pressure. system.disks gives free and total space; system.parts gives the active part count per table. A table with thousands of small active parts is the classic “too many parts” signal, usually caused by inserting too frequently in small batches.
system.mutations and system.merges track background work. Mutations (ALTER … DELETE/UPDATE) are asynchronous and heavy; a stuck one shows up here with a latest_fail_reason. Merges show the progress of the background compaction that keeps part counts down.
system.metrics, system.events, and system.asynchronous_metrics hold the gauges and counters behind memory, connections, QPS, and background pool activity.
You do not need to memorise these. A good mobile client reads them for you and turns them into tiles. Knowing which table sits behind each tile lets you drill in when something is off, and the column-by-column reference for these system tables covers what each value means when it goes wrong.
What to watch first during an incident
Triage order matters when you are on a phone on a cellular connection. A practical sequence:
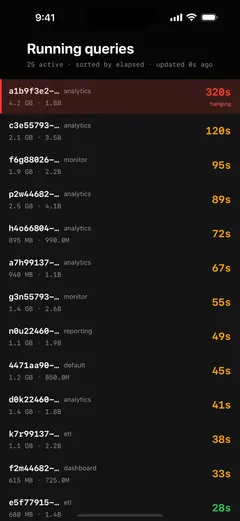
- Running queries. Is one query dominating? Long
elapsedplus high memory is the usual culprit. If a singleSELECTis taking the cluster down, that is your fastest win. See killing a runaway query. - Replication. Any table read-only or lagging badly? Read-only usually means a Keeper problem, not a ClickHouse-node problem. See why a replica lags.
- Disks and parts. A full disk stops writes entirely; a “too many parts” condition degrades everything gradually. See too many parts.
- Mutations and merges. A stuck mutation can hold resources and block progress on a table.
From the phone you understand the situation, take the one action that stops the bleeding, and decide whether this needs the laptop.
Doing it safely from a phone
Reaching production from a pocket device raises the stakes, so the safety model matters as much as the features:
- Credentials stay on the device. Hosts, passwords, TLS material, and SSH keys live in the iOS Keychain and Secure Enclave. There is no account and no backend, and nothing is proxied through the app developer.
- Connect over TLS or an SSH bastion. ProbeDeck talks to ClickHouse over its HTTPS/TLS interface, or through an SSH tunnel to reach a cluster behind a firewall.
- Monitoring is read-only by nature. Watching health, reading
system.processes, and running aSELECTchange nothing. The moment an action does change the cluster, whether that is killing a query, a write, orOPTIMIZE FINAL, it sits behind a type-to-confirm step with a production badge.
That separation is deliberate. You can watch your own production cluster for free and confirm nothing leaves the device long before you pay for the operational features.
Where this fits
Grafana, your desktop SQL IDE, and your alerting stack all keep their jobs. The phone covers the ten minutes between the alert firing and you deciding what to do, when the laptop is across the room and every minute of a stuck query costs you.
ProbeDeck is the native iOS ClickHouse client used in this guide: free monitoring, with a one-time Pro unlock ($19.99) for operations like killing queries, writes, and the AI assistant. No subscription.
Related: ClickHouse system tables for monitoring · A native ClickHouse client for iOS · Kill a runaway ClickHouse query from your phone · Why is my ClickHouse replica lagging?