The alert says a replica is behind. Dashboards on that node are stale, someone is asking whether the numbers are trustworthy, and you are trying to answer from a phone. Replica lag in ClickHouse is one of those failures that looks alarming but often is not. Sometimes the queue is draining a big merge and will catch up on its own. The job on call is to tell that apart from a stuck replica, and to do it fast.
Lag in a ReplicatedMergeTree cluster has a precise meaning, two system tables that explain it, and a checklist short enough to run from a phone. The screenshots use ProbeDeck; a SQL console works the same way.
What replication lag means
ClickHouse replication is per-table, not per-server. Every ReplicatedMergeTree table has its own set of replicas that coordinate through ClickHouse Keeper (or ZooKeeper). The model is a queue: each replica watches Keeper for new parts and merges, then pulls a queue of entries and applies them locally. “Lag” is that queue not keeping up: the local replica has fallen behind the state recorded in Keeper.
Because it is per-table, a single table can lag while the rest of the database is healthy. Start by finding which table, and system.replicas is where you look. The columns that matter:
is_readonly.1means the replica has lost its Keeper session and cannot accept writes. This is the loudest red flag on the row; it points at Keeper, not at the table.absolute_delay. How many seconds this replica is behind. This is the number the alert is usually reacting to.queue_size. How many entries are waiting in the replication queue.future_parts. Parts expected from queued fetches and merges that do not exist locally yet.parts_to_check. Parts flagged as suspect and awaiting verification; a non-zero, growing value here is its own signal.
One row per replica per table, so you can see at a glance whether one table is dragging or the whole node is.
Read the queue behind the delay
absolute_delay tells you that a replica is behind. It does not tell you why. For that you open system.replication_queue, which lists the pending entries the replica is trying to apply. The useful columns:
type. What the entry is:GET_PART(fetch a part from another replica),MERGE_PARTS(merge locally),MUTATE_PART(apply anALTER … UPDATE/DELETE).num_tries. How many times this entry has been attempted. A climbingnum_triesis the single clearest sign of a stuck entry.last_exception. The error from the most recent failed attempt. This is where the reason lives: a missing part on the source, a disk-full, a fetch that keeps timing out.created_time. When the entry was queued. An oldcreated_timesitting near the head of the queue means nothing behind it is moving.
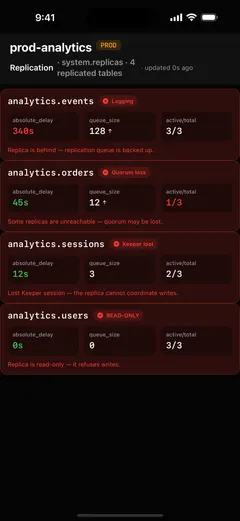
The pattern to look for is whether the queue is moving. Refresh it. If queue_size is shrinking and num_tries stays at zero or one across entries, the replica is working through a backlog and will catch up: that is self-healing lag. If the same entry sits at the head with num_tries climbing and the same last_exception on every refresh, the queue is stuck, and everything queued behind that entry is blocked waiting on it.
The usual causes, and how each one looks
A handful of causes account for most replica lag, and each leaves a distinct fingerprint across those two tables.
Keeper unreachable or slow. If a replica cannot keep its Keeper session, it flips to is_readonly = 1. It cannot accept writes and cannot coordinate, so it falls behind. When is_readonly is set, stop looking at the table. The problem is the Keeper ensemble (a node down, an election in progress, the network to Keeper), not this replica’s merges. Reading the expired session and recovering from it is a separate procedure with its own commands.
A single large merge or mutation. Replication entries apply roughly in order, so one enormous MERGE_PARTS or a heavy MUTATE_PART can hold the head of the queue for a long time while everything behind it waits. Here num_tries stays low, because the entry is running fine over an enormous amount of data. absolute_delay climbs, then drops sharply once the merge lands. This is the most common “looks bad, is fine” case.
A failing entry retrying. An entry that cannot complete keeps retrying: num_tries climbs and last_exception tells you why. A common one is a GET_PART for a part that no longer exists on the source replica (already merged away, or the source itself was in trouble). Another is a disk-full on the source replica, so the fetch cannot be served. This lag does not self-heal; it needs the underlying cause cleared.
Network or a slow fetch. A GET_PART for a large part over a slow or saturated link between replicas can crawl. The entry is not failing, but it is not finishing quickly either. If the lag correlates with fetches of big parts and inter-replica bandwidth is tight, that is your answer.
Under-provisioned. Sometimes nothing is broken and the replica cannot merge as fast as inserts arrive. The queue is always a little long, absolute_delay hovers at a non-zero baseline, no exceptions. That is a capacity conversation.
Triaging it from a phone
Replica lag is worth triaging from a phone because the read side of it is entirely diagnostic: reading system.replicas and system.replication_queue changes nothing. ProbeDeck reads both tables so you can see the delay, the queue depth, and each entry’s num_tries and last_exception on your phone, over TLS or through an SSH bastion, with credentials held in the iOS Keychain. Monitoring is free.
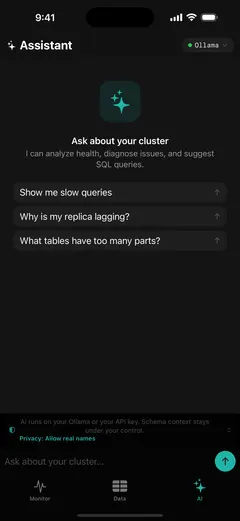
If you have the Pro unlock, the optional AI assistant can read those same two tables and help answer “why is this replica lagging?”, correlating a climbing num_tries with the last_exception behind it. It runs on your own Ollama or your own API key (BYOK); the queries and results stay between your device and your model, and nothing goes to the developer.
The limits are real. From a phone you can diagnose the lag and decide how urgent it is. Most of the fixes live on the laptop: restarting a Keeper node, clearing space on a source disk, rebalancing, or adding a replica. The phone earns its place in the gap between the page firing and you knowing whether this needs a keyboard at all.
The on-call checklist
Run this in order when a replica-lag alert fires:
- Is
is_readonly = 1? If yes, the replica lost its Keeper session. This is a Keeper problem, not a merge problem. Go look at the ensemble; stop debugging the table, and follow the read-only recovery order instead. - Is
absolute_delaygrowing or flat-high? Growing means it is actively falling behind. Flat-high can mean a steady under-provisioned baseline. Watch it across a couple of refreshes. - Is
queue_sizedraining or stuck? Refreshsystem.replication_queue. Shrinking is self-healing. Stuck at the same depth means something at the head is blocking. - Any
last_exceptionwith risingnum_tries? This is the stuck-entry signature. Read the exception; it names the cause (missing part, fetch failure, disk). - Disk space on source and target? A full disk on the source blocks fetches; a full disk on the target blocks merges. Check both.
- Network or a large-part fetch? If the head entry is a
GET_PARTfor a big part and inter-replica bandwidth is tight, the lag is a slow fetch. It will finish, given time.
Work down that list and you will land in one of two places: lag that is draining on its own and needs nothing, or a specific cause with a specific fix. Either way you will know which, and whether it can wait until you are back at a keyboard.
ProbeDeck is a native iOS ClickHouse client: free monitoring of system.replicas and system.replication_queue from your phone, with a one-time Pro unlock ($19.99) for operations and the AI assistant. No subscription.
Related: ClickHouse replica lag on your phone · When the replica is read-only instead of lagging · The system tables behind these numbers · Monitor ClickHouse from your iPhone · How to monitor ClickHouse from your iPhone