The pager goes off. A dashboard is timing out, memory on one node is pinned, and QPS looks normal, which points at a single query eating the cluster rather than a flood of traffic. Your laptop is in the other room. The fix is usually small: find the offending query and stop it, which ProbeDeck does from an iPhone in about a minute. KILL also does less than most people assume, and that part is worth knowing before you tap it.
Step 1: Find the query in system.processes
Everything running right now lives in system.processes. It is the first place to look when something is on fire, and reading it is free: no unlock, no account, only a connection. Which columns to read there, and in the six other tables that carry on-call signal, is its own guide.
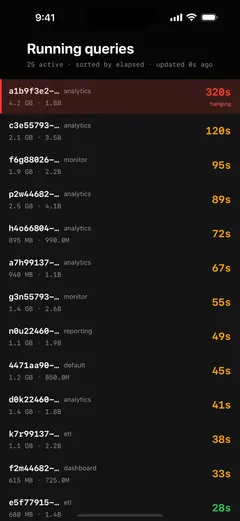
Each active query shows up with a query_id, the user who launched it, elapsed (how long it has been running, colour-graded by duration so the old ones jump out), memory_usage, and rows read. On a phone you sort by elapsed and the culprit is usually right at the top: one query that has been running for minutes while everything else is measured in milliseconds, holding a lot of memory and grinding through a large number of rows.
That colour grading earns its keep at 3 a.m. Half-awake, you find the one red row that says this one has been going for four minutes without parsing a table of microsecond timings. It is a starting point; the verdict comes next.
Step 2: Judge before you kill
A long-running query is not automatically a wrong query, and skipping this step at 3 a.m. is how you turn one incident into two.
Before you touch anything, read the row properly:
- Elapsed. Four minutes on an analytical
SELECTmight be normal. Four minutes on something that usually returns instantly is not. - Memory. A query climbing toward the node’s limit is a threat to everything else on the box.
- The user. An ETL service account running a heavy job may be a legitimate scheduled backfill. Your own ad-hoc session from an hour ago that you forgot about is a very different story.
- The SQL. This is the tell. A
SELECTwith noLIMITscanning a huge table, aJOINthat blew up, an aggregation across every partition: that is a runaway. A tidyINSERT ... SELECTdoing a planned migration is not.
The distinction that matters is legitimate backfill versus runaway ad-hoc query. Killing a backfill that was three hours into rebuilding a table is its own incident. Spend the ten seconds: the SQL preview plus the user usually tells you which one you are looking at. If you cannot tell, reach for the laptop or ping whoever owns that service.
Step 3: KILL QUERY, with a confirmation you can trust
Once you have decided, the action takes several taps by design.
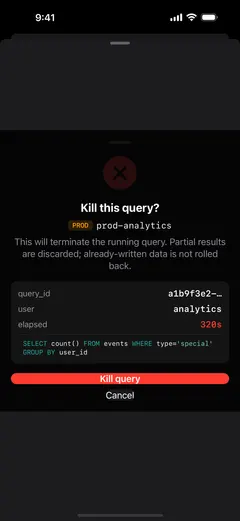
In ProbeDeck you tap the query, and a confirmation sheet comes up showing the query_id, the user, how long it has run, and a preview of the SQL: the same facts you used to make the call, amplified so you cannot misread them, on a connection carrying a PROD badge if that is where you are pointed. Production connections are badged amber so you never confuse them with staging. Behind the sheet, the app runs a plain KILL QUERY WHERE query_id='…' against exactly the query you picked.
Destructive actions sit behind a type-to-confirm step: a hard confirm where you type to proceed, so a stray thumb cannot trigger it. That guard covers KILL and the other operations that change the cluster. A phone is easy to fumble, and a mis-tap against production should cost you a few seconds of typing.
A note on pricing so it is not a surprise mid-incident: killing a query is part of the one-time Pro unlock ($19.99, no subscription). The KILL button is visible on the free tier with a PRO badge, so you discover it while reading the screen, long before you need it. Monitoring stays free: opening the app, reading system.processes, watching the cluster.
What KILL does (and does not)
Most tools gloss over this, and getting it wrong leads to bad decisions during an incident. ProbeDeck shows no fake “Undo,” because for these operations there is nothing honest to undo.
KILL QUERYasks the query to stop. The query winds down at a safe point and releases its resources, usually quickly, but not always instant. If it does not vanish the moment you confirm, that is expected; give it a few seconds before assuming something is wrong.KILL MUTATIONcancels a mutation but does not roll back rows already changed. If anALTER ... UPDATE/DELETEhad already rewritten part of a table, cancelling stops further work. It does not un-change what it already changed. There is no rewind.DROPandTRUNCATEare irreversible. They are not on the “stop a query” path, but the same honesty applies: once run, the data is gone, and no app can bring it back.
KILL QUERY stops work without destroying data, which makes it the right first move against a runaway SELECT. Mutations and drops are where you slow down, because “stop” and “undo” are not the same thing.
After the kill, the cause is still there
Killing a query frees its resources without fixing why the query went bad. The missing LIMIT is still missing, and the dashboard that generated a monster query will generate it again on the next refresh.
Treat the kill as the action that stops the bleeding, then follow up. Note the query_id and the SQL while you have them on screen. When you are back at a laptop, that is your thread to pull: add the LIMIT, fix the join, put a per-user memory or time cap in place so the next runaway trips a guardrail instead of your pager.
ProbeDeck is a native iOS ClickHouse monitoring and on-call client: free monitoring for reading system.processes and watching your cluster, with a one-time Pro unlock ($19.99) for operations like killing queries. No subscription, no account, no backend. Credentials stay in the iOS Keychain, and it connects over TLS or an SSH bastion.
Related: Kill a ClickHouse query from iOS · How to monitor ClickHouse from your iPhone · Why is my ClickHouse replica lagging?