ClickHouse diagnoses itself. Every piece of state you need during an incident, from the query eating the cluster to the mutation that has been retrying since Tuesday, is a SELECT away in the system database. No exporter, no agent required.
The catch is volume. A recent server exposes well over a hundred tables in system, and the reference documentation lists them alphabetically, which is the least useful order when something is on fire. Seven of them carry nearly all of the signal you act on, and each has two or three columns that matter more than the rest.
Everything here is plain SQL. It runs in clickhouse-client, over the HTTP interface, or from a phone. The queries do not care.
First: every system table describes one node
This trips people up more than any single column. system.processes shows the queries running on the node you are connected to. Same for system.parts, system.mutations, system.disks, and the rest. Point your client at a load balancer in front of six nodes and you get a different node’s view every time you refresh, which is a memorable way to spend twenty minutes chasing a query that keeps disappearing.
On a cluster, wrap the table:
SELECT hostName() AS host, query_id, user, elapsed
FROM clusterAllReplicas('default', system.processes)
ORDER BY elapsed DESC;
clusterAllReplicas fans the query out to every replica in the named cluster and unions the results. Add hostName() to the select list or you will not know which row came from where. Replace 'default' with your own cluster name from system.clusters.
Two exceptions worth knowing. system.replicas and system.replication_queue are already per-table-per-replica on the node that owns the replica, so one node’s view of a table it hosts stands on its own, though you still see only the replicas that node hosts. ClickHouse writes system.query_log locally on the node that ran the query, so a post-mortem across a cluster needs the fan-out or a table that aggregates logs centrally.
system.processes: what is running right now
The first table in any incident. One row per query currently executing on this node.
SELECT query_id, user, elapsed,
       formatReadableSize(memory_usage) AS mem,
       read_rows, formatReadableSize(read_bytes) AS read,
       substring(query, 1, 120) AS q
FROM system.processes
ORDER BY elapsed DESC;
Sort by elapsed, not by memory_usage. Memory tells you which query is expensive; elapsed tells you which one is in the way. A query that has been running for forty minutes has been holding locks and pool slots for forty minutes, and everything queued behind it is waiting on it. The heavy query that started nine seconds ago is often fine.
The columns that earn their place:
query_id. The handle you need forKILL QUERY. Copy it before you do anything else; if the query finishes between yourSELECTand your kill, you want to know that you killed nothing rather than wonder.elapsed. Seconds since the query started. Your sort key.memory_usage. Current bytes for this query. Wrap it informatReadableSize(). Reading raw byte counts at 3 a.m. is how mistakes happen.read_rowsandread_bytes. How much this query has chewed through so far. ASELECTat four billion rows read and climbing is scanning something it should not be.userandclient_hostname. Who to blame, or which service to check for a retry loop. A dashboard that fires the same expensive query every thirty seconds shows up here as several near-identical rows from the same user.is_cancelled. ClickHouse sets this once a kill has landed but the query has not stopped. A 1 here means you are waiting rather than being ignored.
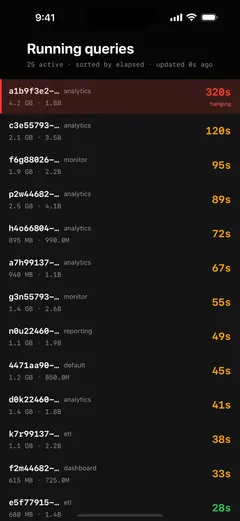
When you have found the offender, KILL QUERY WHERE query_id = '…' stops it. Kill is asynchronous by default. The statement returns and the query stops when it next checks the cancellation flag, which for a query stuck in a long merge can take a while. Add SYNC when you need confirmation that it stopped before you move on, and use ON CLUSTER if you are not connected to the node running the query. The details, including the cases where a kill does not land, are in killing a runaway query.
One habit worth building: before you kill, look at whether the same query text appears more than once. Killing one instance of a query that a scheduler is re-issuing every minute buys you sixty seconds.
system.replicas: is replication healthy
One row per replicated table on this node. A replication problem shows up here first.
SELECT database, table, is_readonly, absolute_delay,
       queue_size, future_parts, parts_to_check, is_session_expired
FROM system.replicas
WHERE absolute_delay > 60 OR is_readonly OR queue_size > 100
ORDER BY absolute_delay DESC;is_readonly. The loudest signal in the table.1means the replica has lost its ZooKeeper or ClickHouse Keeper session and can no longer accept writes or coordinate. When this is set, stop investigating the table. The problem is the Keeper ensemble: a node down, or an election in progress. Nothing you do to the table will fix it.is_session_expired. The same story from the other side, and usually set alongsideis_readonly. What to read next when both are set coversreadonly_start_time,system.zookeeper_connectionand the recovery order.absolute_delay. Seconds this replica is behind the leader. This is the number your alert is reacting to. Judge it against your own ingestion pattern rather than a universal threshold: a table with a heavy hourly batch normally shows a delay spike as the batch lands.queue_size. Entries waiting in the replication queue. Read it twice, a minute apart. Shrinking means the replica is working through a backlog and will catch up on its own. Stuck at the same depth means something at the head is blocking everything behind it.future_parts. Parts expected from queued fetches and merges that do not exist locally yet. A large number here alongside a stuck queue means the replica knows about work it cannot do.parts_to_check. Parts flagged as suspect and awaiting verification. Non-zero and growing is its own problem, usually after an unclean shutdown or a disk issue.
The distinction that matters: is_readonly sends you to Keeper. absolute_delay with a draining queue means wait. absolute_delay with a stuck queue sends you to the next table. Why a replica lags walks through the full set of causes and what each one looks like.
system.replication_queue: why the queue stopped
system.replicas tells you that a replica is behind. This table tells you why. One row per pending replication task.
SELECT database, table, type, num_tries, create_time,
       last_exception, postpone_reason
FROM system.replication_queue
WHERE num_tries > 1 OR last_exception != ''
ORDER BY num_tries DESC
LIMIT 20;type. What the entry is trying to do.GET_PARTfetches a part from another replica,MERGE_PARTSmerges locally,MUTATE_PARTapplies anALTER … UPDATE/DELETE,DROP_RANGEremoves a range of parts.num_tries. How many attempts this entry has made. A climbingnum_triesis the single clearest sign of a genuinely stuck entry, as opposed to a large one still running.last_exception. The error from the most recent failed attempt. You get the cause here before any dashboard has it: a part missing on the source replica, or a disk-full on the sending side.postpone_reason. ClickHouse fills this in when it defers the entry: the parts it needs are being merged, or an earlier entry has not finished. A postponed entry is queued behind something rather than broken.create_time. When the entry was queued. An oldcreate_timenear the head of the queue means nothing behind it has moved since then.
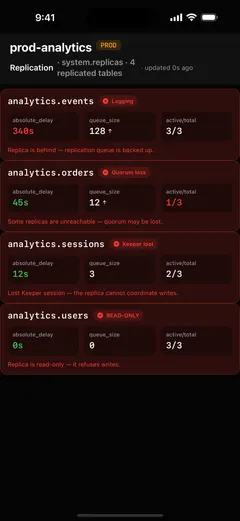
The most common false alarm in this table is a single enormous MERGE_PARTS at the head of the queue with num_tries at 0 or 1. Nothing is wrong. A merge over several hundred gigabytes takes as long as it takes, absolute_delay climbs while it runs, and both recover sharply when it lands. The signature of an actual problem is num_tries climbing with the same last_exception on every refresh.
system.parts and system.merges: part pressure
ClickHouse never updates a row in place. Every insert writes immutable parts, and a background process merges small parts into larger ones. When merges stop keeping up with inserts, part count climbs, and past a threshold the server starts rejecting writes with Too many parts.
SELECT database, table, count() AS parts,
       formatReadableSize(sum(bytes_on_disk)) AS size,
       sum(rows) AS rows
FROM system.parts
WHERE active
GROUP BY database, table
ORDER BY parts DESC
LIMIT 10;
The WHERE active filter is not optional. system.parts retains inactive parts, the small ones already merged away but not yet cleaned up. Without the filter your counts come out several times higher than reality and you diagnose a crisis that does not exist.
A few hundred active parts on a large table is normal. A few thousand on one table, climbing while you watch, is the condition that eventually rejects your inserts. What matters more than the absolute number is the trend across two readings a minute apart.
Then check whether merges are running at all:
SELECT database, table, elapsed, progress, num_parts,
       formatReadableSize(total_size_bytes_compressed) AS size,
       formatReadableSize(memory_usage) AS mem
FROM system.merges
ORDER BY elapsed DESC;
The combination tells you which problem you have:
system.parts |
system.merges |
What it means |
|---|---|---|
| Climbing | Active merges running | Inserts arrive too small and too often. Fix the write path: batch harder, or use async inserts |
| Climbing | Empty or idle | The background pool is busy elsewhere, usually with a mutation, or merges were switched off |
| Climbing | One merge, progress frozen |
A stuck merge is holding a pool slot |
| Flat and high | Steady merges | A steady state you may not love, but not an incident |
An empty system.merges while part count climbs is worth pausing on, because the reflex it triggers, OPTIMIZE FINAL, is usually the wrong move and often makes things worse. What the too-many-parts signal means covers the mechanism, and five checks before you restart the server covers the stuck-merge case specifically.
Also check whether someone turned merges off, which happens more often than anyone admits:
SELECT * FROM system.metrics WHERE metric LIKE '%BackgroundMerges%';If the pool is idle, the disks have room, and nothing is queued, run SYSTEM START MERGES on the table and watch whether system.merges fills up.
system.mutations: the ALTER that never finished
ALTER TABLE … UPDATE and ALTER TABLE … DELETE in ClickHouse are asynchronous background rewrites rather than transactions, and they share the same pool that merges use. One stuck mutation starves merges on the whole node, which is why a part-count problem so often turns out to be a mutation problem.
SELECT database, table, mutation_id, create_time,
       parts_to_do, is_done, latest_fail_reason,
       substring(command, 1, 100) AS cmd
FROM system.mutations
WHERE NOT is_done
ORDER BY create_time;parts_to_do. How many parts still need rewriting. Read it twice. Decreasing means the mutation is working. Frozen means it is not.latest_fail_reason. The important one. Empty means the mutation is slow but healthy. Non-empty means it has failed and will retry forever, consuming pool capacity on every attempt, until you kill it.create_time. A mutation from three weeks ago still sitting atis_done = 0has been abandoned.
A mutation with a permanent failure (a type that cannot be cast, or a column that no longer exists) never resolves itself. KILL MUTATION WHERE mutation_id = '…' stops it, and then the ALTER needs rewriting before you try again. Until you do, every merge on that table is competing with a doomed retry loop.
system.disks: space
The shortest query in this guide and the one most likely to explain everything else.
SELECT name, path,
       formatReadableSize(free_space) AS free,
       formatReadableSize(total_space) AS total,
       round(100 * (1 - free_space / total_space), 1) AS pct_used
FROM system.disks;
ClickHouse needs room to write a merge’s output before it can drop the inputs, so it stops scheduling large merges well before the disk fills. A disk at 85–90 percent starts a slow cascade: ClickHouse skips the big merges, part count climbs, and nothing in the log says “I skipped this merge because of space.” A disk check belongs early in triage because its symptoms surface somewhere else.
On a cluster, check the source replica’s disk too when fetches are failing. A GET_PART that keeps timing out is sometimes a full disk on the node being fetched from.
system.query_log: the post-mortem table
The other six tables describe now. This one describes then: the difference between “the cluster was slow around 02:00” and knowing which query did it.
SELECT type, count() AS n,
       formatReadableSize(sum(read_bytes)) AS read,
       formatReadableSize(max(memory_usage)) AS peak_mem
FROM system.query_log
WHERE event_time BETWEEN '2026-08-22 02:00:00' AND '2026-08-22 03:00:00'
GROUP BY type;
type separates QueryStart, QueryFinish, ExceptionBeforeStart, and ExceptionWhileProcessing. A spike in the exception types during your window confirms the cluster was rejecting work rather than running slow.
To find the specific queries:
SELECT event_time, query_duration_ms, formatReadableSize(memory_usage) AS mem,
       read_rows, exception, substring(query, 1, 150) AS q
FROM system.query_log
WHERE event_time > now() - INTERVAL 1 HOUR
  AND type != 'QueryStart'
ORDER BY query_duration_ms DESC
LIMIT 20;
Two caveats. ClickHouse writes system.query_log asynchronously, so the last few seconds of activity may be missing; SYSTEM FLUSH LOGS forces the flush when you need the tail. It also writes the log on the node that ran the query, so a cluster-wide post-mortem needs clusterAllReplicas or a centrally aggregated copy.
The gauges: system.metrics, system.events, system.asynchronous_metrics
Three tables of numbers, easy to confuse:
system.metrics. Instantaneous gauges. How many queries are running right now, how many merges are active, how many connections are open. Read it to answer “what is the state at this instant.”system.events. Cumulative counters since the server started: total queries, total failed queries, total bytes read. A single reading tells you almost nothing; the delta between two readings gives you a rate.system.asynchronous_metrics. Values ClickHouse collects on a background timer rather than on demand: memory in use, disk space, replica delays. Cheap to read, stale by a few seconds.
The one to memorise for incidents:
SELECT metric, value FROM system.metrics
WHERE metric IN ('Query', 'Merge', 'PartMutation',
                 'ReplicatedFetch', 'ReplicatedSend',
                 'BackgroundMergesAndMutationsPoolTask',
                 'BackgroundMergesAndMutationsPoolSize');
When BackgroundMergesAndMutationsPoolTask equals BackgroundMergesAndMutationsPoolSize, every worker is busy and new merges are queuing. Compare those two and you have answered most of the “why did merges stop” questions.
Symptom to table
The lookup you want at 3 a.m.:
| Symptom | Table | What to read |
|---|---|---|
| Everything is slow | system.processes |
Longest elapsed, then memory_usage |
Writes rejected, Too many parts |
system.parts + system.merges |
Active part count per table, whether merges run |
| Replica alert fired | system.replicas |
is_readonly first, then absolute_delay |
| Replica behind and not catching up | system.replication_queue |
num_tries, last_exception |
An ALTER never finished |
system.mutations |
parts_to_do, latest_fail_reason |
| Merges stopped for no reason | system.disks + system.metrics |
Free space, then pool task vs pool size |
| It was slow an hour ago | system.query_log |
type, query_duration_ms, exception |
| Ingestion stalled, no error yet | system.parts |
Active parts trend across two readings |
Set this up before you need it
Three things are easier to arrange on a Tuesday afternoon than during an incident.
Grant the on-call user what it needs. Reading system tables requires privileges, and finding out that your incident account cannot SELECT from system.replicas is a bad way to learn it. The same goes for KILL QUERY, which is its own grant. An account that can see the runaway query but cannot stop it is a special kind of frustrating.
GRANT SELECT ON system.* TO oncall;
GRANT KILL QUERY ON *.* TO oncall;
Check that query_log is on. ClickHouse enables it by default, but plenty of clusters have it switched off in a config someone wrote to save disk, and you will find out at the wrong moment:
SELECT value FROM system.settings WHERE name = 'log_queries';
SELECT max(event_time) FROM system.query_log;
If the second query returns nothing or something from last month, your post-mortem table is not collecting.
Give the log tables a TTL. system.query_log grows without bound on a busy cluster. A TTL on the table keeps a useful window without letting it eat the disk you needed for merges.
Reading these from a phone
Everything above is plain SQL that runs anywhere. The reason to care about the phone case is timing. A stuck query does most of its damage in the ten minutes between the alert firing and you reaching a laptop, and that is the window where knowing what you are dealing with saves you something.
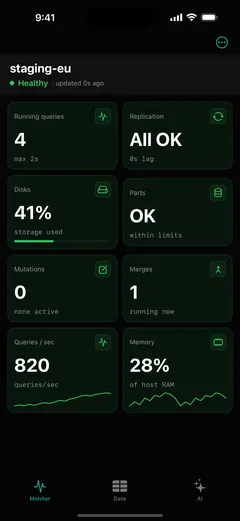
ProbeDeck is a native iOS client that reads these tables and grades them: running queries from system.processes, replication from system.replicas and system.replication_queue, storage from system.parts and system.disks, background work from system.mutations and system.merges. It connects over TLS or through an SSH bastion, and credentials stay in the iOS Keychain. Monitoring and read-only SQL are free; killing queries and mutations, writes, and DDL sit behind the one-time Pro unlock and a type-to-confirm step.
The limit is the same one any phone has. You can read all seven tables and take the one action that stops the bleeding. Restarting a Keeper node or rewriting a broken ALTER is still laptop work. What the phone buys you is knowing which of those you are facing before you get there.
ProbeDeck is a native iOS ClickHouse client: free monitoring of the system tables in this guide, with a one-time Pro unlock ($19.99) for operations and the AI assistant. No subscription.
Related: How to monitor ClickHouse from your iPhone · Kill a runaway ClickHouse query · Why is my ClickHouse replica lagging? · ClickHouse merge is stuck · Too many parts on call
ClickHouse is a registered trademark of ClickHouse, Inc. ProbeDeck is not affiliated with, endorsed by, or sponsored by ClickHouse, Inc.